A new study reveals surprising trends about which regions in the UK take the most sick days. Using data from the Office for National Statistics (ONS), Claims.co.uk has analyzed sickness and absence within the UK labour market over a ten-year period, from 2013 to 2022. Here are the findings on where workers are most likely to call in sick.
10. South East of England

The South East of England ranks tenth, with an average of 4.05 sick days per worker each year. Despite this, it has the highest number of total days lost due to its large population, averaging 18.29 million workdays lost annually.
10. East of England

Tying with the South East, the East of England also sees an average of 4.05 sick days per worker annually. This region lost 12.39 million workdays each year on average over the ten-year period.
9. South West of England

In ninth place is the South West of England, where workers take an average of 4.44 sick days per year. The year 2022 saw the most days lost, with an average of 5.9 days per worker and 16.5 million workdays lost in total.
8. West Midlands

The West Midlands ranks eighth, with workers taking an average of 4.49 sick days annually. Over the ten-year period, this region lost an average of 12.22 million workdays per year.
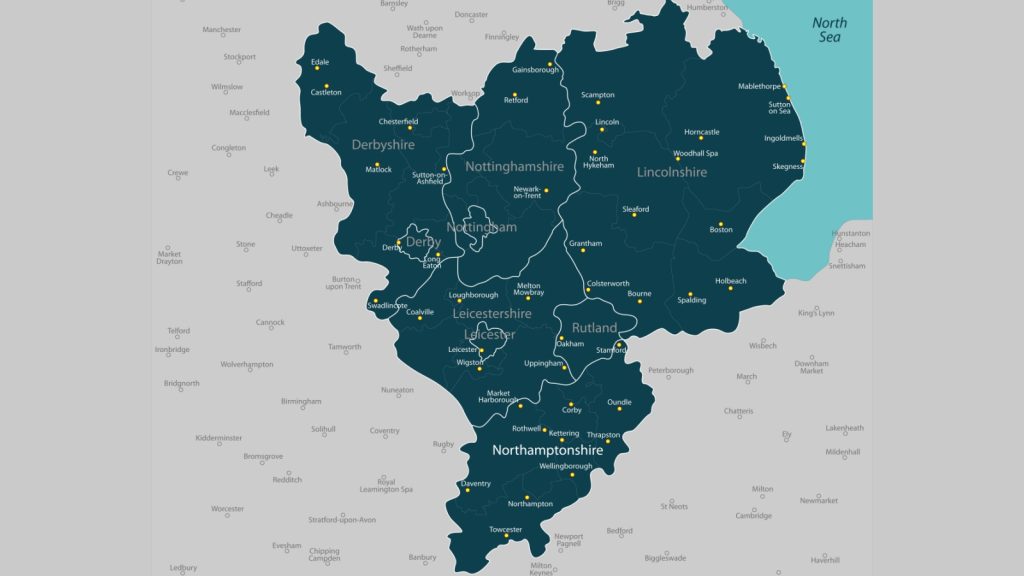
7. East Midlands

The East Midlands is seventh, with workers losing an average of 4.63 days per year to sickness. The region saw its highest numbers in 2022, with six days lost per worker and 14 million total workdays lost.
6. Yorkshire and The Humber

Yorkshire and The Humber ranks sixth, with an average of 4.74 sick days per worker each year. This region lost a total of 12.06 million workdays per year on average.
5. North West of England

In fifth place, the North West of England sees workers taking an average of 4.8 sick days per year. This region has the second-highest total days lost, with 16.24 million workdays lost annually.
4. Northern Ireland

Northern Ireland ranks fourth, with an average of 4.86 sick days per worker each year. Despite its smaller population, it lost 4.06 million workdays annually, with 2022 seeing the highest figure of 5.1 million days.
3. Scotland

Scotland is in third place, with an average of 4.87 sick days per worker each year. In 2022, Scotland had the highest number of sick days per worker (6.5 days) and the highest total days lost (17.7 million).
2. North East of England

The North East of England ranks second, losing an average of 5.11 days per worker annually. This region saw the second-lowest total workdays lost due to its smaller population, averaging 6.07 million days per year.
1. Wales

Wales takes the top spot as the UK’s calling-in-sick capital, with an average of 5.64 sick days per worker each year. The year 2022 was particularly high, with eight days lost per worker and a total of 11.6 million workdays lost.
Methodology

Claims.co.uk analyzed data from the ONS on sickness and absence within the UK labour market from 2013 to 2022. The study considered the average number of sick or absence days taken per worker in each UK region. The final ranking is based on the average annual days lost per worker due to sickness or absence over the ten-year period.
Katy Willis is a writer, master herbalist, master gardener, and certified canine nutritionist who has been writing since 2002. She’s finds joy in learning new and interesting things, and finds history, science, and nature endlessly fascinating.

